Matplotlib - Grid Line Style
Matplotlib - Grid Line Style
In Matplotlib, you can choose a line style for the grid. For example, you can set dashed lines, dotted lines, etc., using line style.
To set a specific style for the lines in grid, call the grid() function from matplotlib.pyplot and pass required value such as 'dashed', 'dotted', 'dashdot', '--', etc., as the argument for the linestyle parameter.
By default the grid lines are displayed as solid lines.
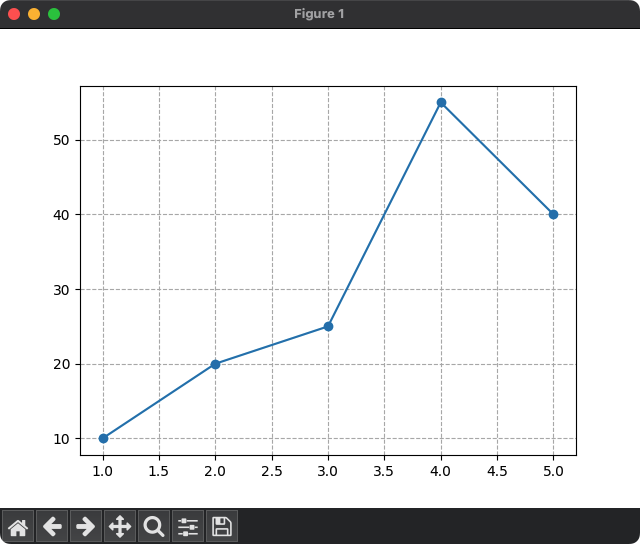
For example, plt.grid(linestyle='dashed') displays the grid with dashed lines.
import matplotlib.pyplot as plt
plt.grid(linestyle='dashed')
The following is a list of all Matplotlib Linestyle Values.
| linestyle | Description |
|---|---|
'-' | Solid Line |
'--' | Dashed Line |
':' | Dotted Line |
'-.' | Dash-dot Line |
'' or 'None' or None | No Line |
' ' | No Line |
'-' | Solid Line (Alias for 'solid') |
'dotted' | Dotted Line (Alias for ':') |
'dashed' | Dashed Line (Alias for '--') |
'dashdot' | Dash-dot Line (Alias for '-.') |
Examples
1. Line style = "dashed" for Grid in Matplotlib
In the following program, we shall display dashed lines in the grid using linestyle='dashed'.
Python Program
import matplotlib.pyplot as plt

# Example data
x = [1, 2, 3, 4, 5]
y = [10, 20, 25, 55, 40]

# Plot the data
plt.plot(x, y, marker='o')

# Grid with specific linestyle
plt.grid(linestyle='dashed')

# Show the plot
plt.show()
Output

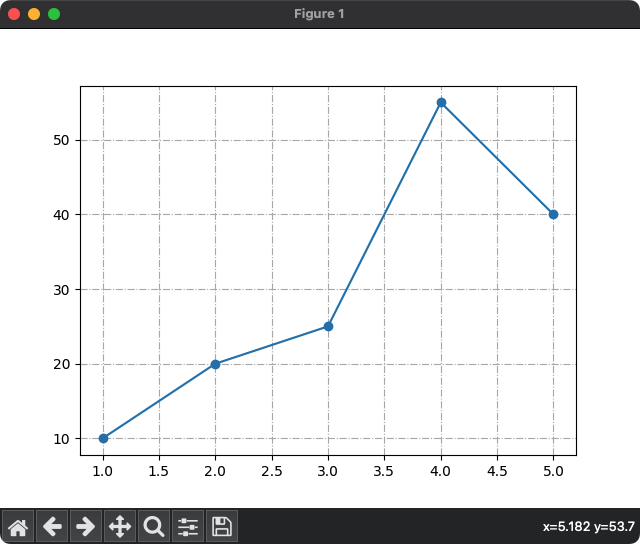
2. Line style = "dashdot" for Grid in Matplotlib
In the following program, we shall display dashdot lines in the grid using linestyle='-.'.
Python Program
import matplotlib.pyplot as plt

# Example data
x = [1, 2, 3, 4, 5]
y = [10, 20, 25, 55, 40]

# Plot the data
plt.plot(x, y, marker='o')

# Grid with specific linestyle
plt.grid(linestyle='-.')

# Show the plot
plt.show()
Output
