Matplotlib - Label Font Color
Matplotlib - Label Font Color
To set a specific font color for a label of the plot in Matplotlib, you can use color parameter, or fontdict parameter of the label functions.
In this tutorial, we shall go through both the approaches, and look into the situations when to use which.
Approach 1: Using color parameter
This approach is used when you would like to change the font color for a specific label, i.e., when granular customization is required.
# Using built-in color value
plt.xlabel('X-axis Sample Label', color = 'red')
# Using Hex value for color
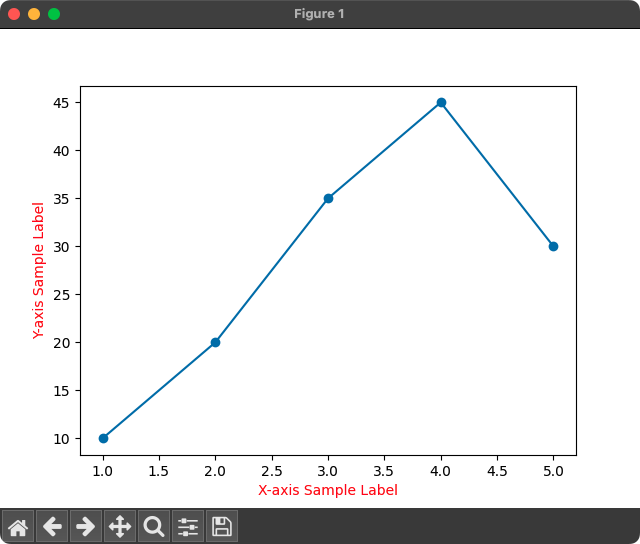
plt.ylabel('Y-axis Sample Label', color = '#22BB33')X-axis label is set with font color of 'red', and Y-axis label is set with a font color of '#22BB33'. You can also use other font colors or Hex values depending on your preference.
Python Program
import matplotlib.pyplot as plt

# Example data
x = [1, 2, 3, 4, 5]
y = [10, 20, 35, 45, 30]

# Plot the data
plt.plot(x, y, marker='o')

# Set font for the labels
plt.xlabel('X-axis Sample Label', color = 'red')
plt.ylabel('Y-axis Sample Label', color ='#22BB33')

# Show the plot
plt.show()
Output
Approach 2: Using fontdict parameter
This approach is useful when you would like to set a specific font for all the labels, like a global setting for the font, and you would like to make the code more modular. In the font dictionary object, specify the size attribute with the required size value.
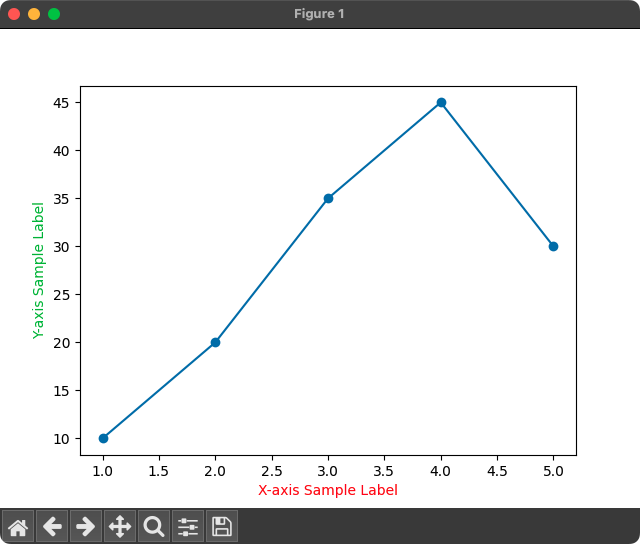
my_font = {'color': 'red'}
plt.xlabel('X-axis Sample Label', fontdict = my_font)
You can also specify the label font family, and label font size in addition to the label font color.
In the following program, we set the font color to 'red' for both X-axis and Y-axis labels using fontdict parameter.
Python Program
import matplotlib.pyplot as plt

# Example data
x = [1, 2, 3, 4, 5]
y = [10, 20, 35, 45, 30]

# Plot the data
plt.plot(x, y, marker='o')

# Font with specific color
my_font = {'color': 'red'}

# Set font for the labels
plt.xlabel('X-axis Sample Label', fontdict = my_font)
plt.ylabel('Y-axis Sample Label', fontdict = my_font)

# Show the plot
plt.show()
Output