Matplotlib plot() - Marker Size
Matplotlib plot() - Marker size
To set a specific size for markers in the plot, you can use the markersize or ms(short for markersize) parameter of the plot() function.
For example, let us set the size of markers to 25,
plt.plot(x, y, ms = 25)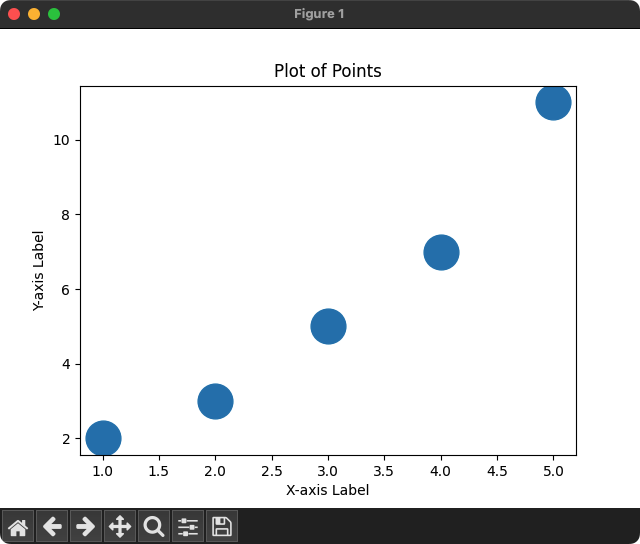
1. Set marker size to 25 in the Matplotlib plot
In the following program, we set the marker edge size to 25 using the ms parameter of plot() function.
Python Program
import matplotlib.pyplot as plt

# Example data
x = [1, 2, 3, 4, 5]
y = [2, 3, 5, 7, 11]

# Plot points with Marker Size = 25
plt.plot(x, y, 'o', ms = 25)

# Customize plot
plt.title('Plot of Points')
plt.xlabel('X-axis Label')
plt.ylabel('Y-axis Label')

# Show the plot
plt.show()
Output
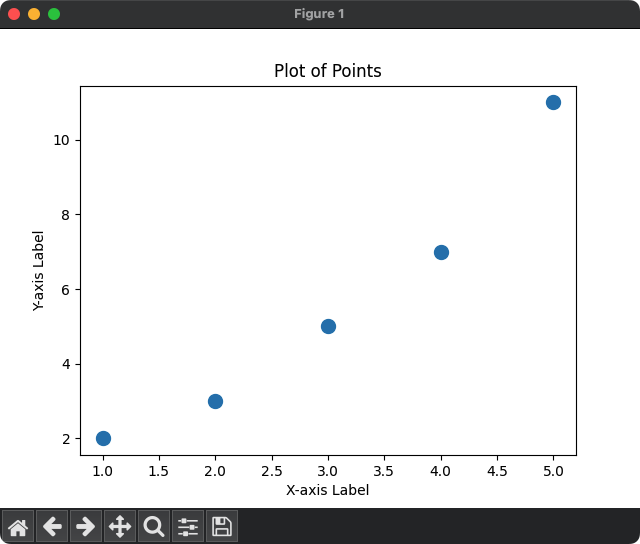
2. Set marker size to 10 in the Matplotlib plot
In the following program, we set the marker edge size to 10 using the ms parameter of plot() function.
Python Program
import matplotlib.pyplot as plt

# Example data
x = [1, 2, 3, 4, 5]
y = [2, 3, 5, 7, 11]

# Plot points with Marker Size = 10
plt.plot(x, y, 'o', ms = 10)

# Customize plot
plt.title('Plot of Points')
plt.xlabel('X-axis Label')
plt.ylabel('Y-axis Label')

# Show the plot
plt.show()
Output