Matplotlib – Grid
In Matplotlib, you can add a grid to your plot to improve readability and make it easier to interpret the data.
To display a grid, call the grid() function from matplotlib.pyplot and pass True as the argument. For example, plt.grid(True) enables the grid for the plot with default options.
import matplotlib.pyplot as plt
plt.grid(True)
Example for Grid
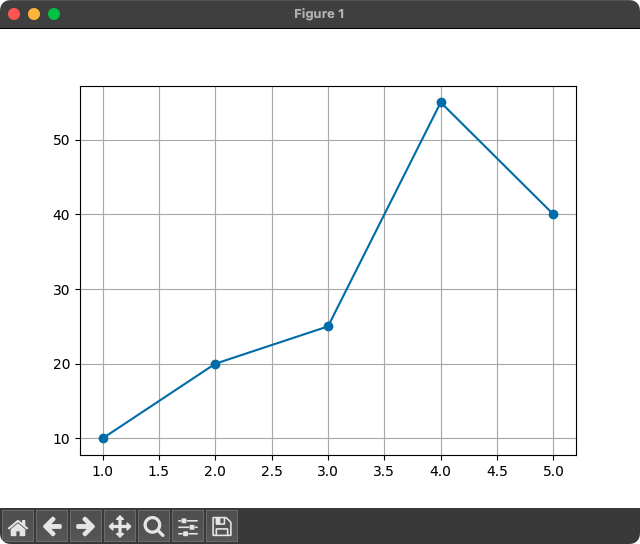
In the following program, we shall display a plot with a line, and display grid using grid() function.
Python Program
import matplotlib.pyplot as plt

# Example data
x = [1, 2, 3, 4, 5]
y = [10, 20, 25, 55, 40]

# Plot the data
plt.plot(x, y, marker='o')

# Add a grid to the plot
plt.grid(True)

# Show the plot
plt.show()
Output
