Matplotlib plot() - Marker Face Color
Matplotlib plot() - Marker face color
To set a specific color for the face of markers in the plot, you can use the markerfacecolor or mfc(short for markerfacecolor) parameter of the plot() function.
For example, let us set red color for the markers using predefined short color value,
plt.plot(x, y, mfc = 'r')'r' for red.
You can also use Hex color like #78FF99, in RGB format, for the marker face.
plt.plot(x, y, mfc = '#78FF99')1. Set marker face color to red using short color value
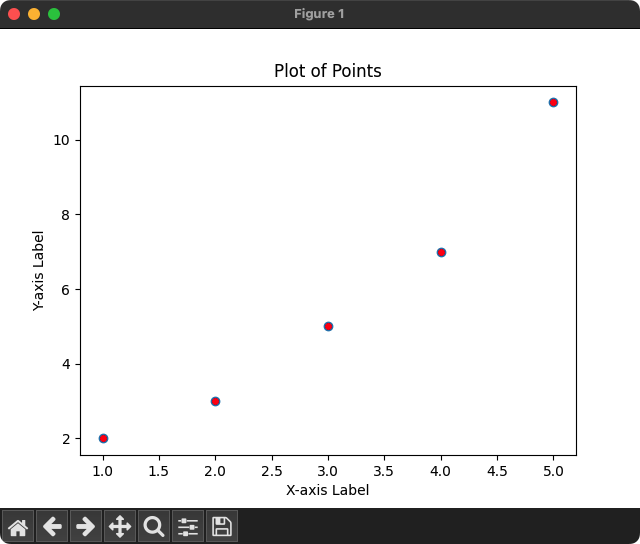
In the following program, we set the marker face color to red using the short color value 'r' for the mfc parameter.
Python Program
import matplotlib.pyplot as plt

# Example data
x = [1, 2, 3, 4, 5]
y = [2, 3, 5, 7, 11]

# Plot points with Red marker face color
plt.plot(x, y, 'o', mfc = 'r')

# Customize plot
plt.title('Plot of Points')
plt.xlabel('X-axis Label')
plt.ylabel('Y-axis Label')

# Show the plot
plt.show()
Output
The following table provides other short color values and the color name.
| Short Color Value | Color name |
|---|---|
| 'r' | Red |
| 'g' | Green |
| 'b' | Blue |
| 'c' | Cyan |
| 'm' | Magenta |
| 'y' | Yellow |
| 'k' | Black |
| 'w' | White |
2. Set marker face color to red using Hex color value
In the following program, we set the marker face color to red using the Hex color value '#78FF99' for the mfc parameter.
Python Program
import matplotlib.pyplot as plt

# Example data
x = [1, 2, 3, 4, 5]
y = [2, 3, 5, 7, 11]

# Plot points with Hex value for Marker Face Color
plt.plot(x, y, 'o', mfc = '#78FF99')

# Customize plot
plt.title('Plot of Points')
plt.xlabel('X-axis Label')
plt.ylabel('Y-axis Label')

# Show the plot
plt.show()
Output
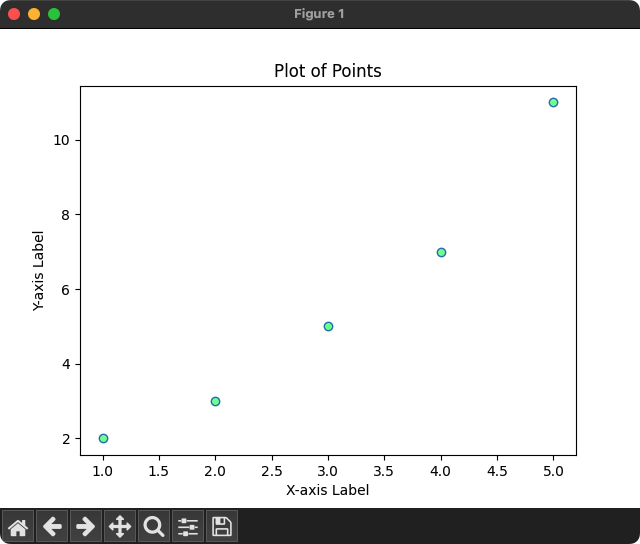
Hex color gives you a fine tuning of the Red, Green, and Blue color channels for selecting a specific color of your requirement.