Matplotlib - Y-axis Label
Matplotlib - Y-axis label
In Matplotlib, you can add a label to the Y-axis to provide context and information about the data being visualized along the vertical axis.
The Y-axis label can be specified using ylabel() function of matplotlib.pyplot. Pass the label value as argument to the ylabel() function, and the given value shall be displayed as label along the Y-axis of the plot.
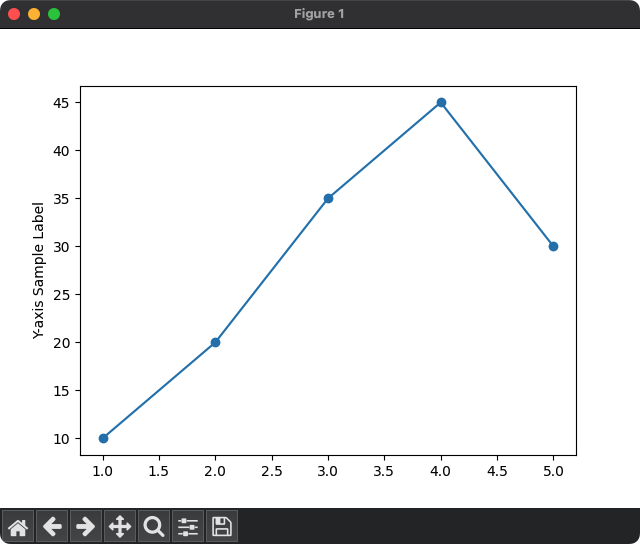
For example, in the following program, we shall plot a line graph, and then specify Y-axis label as 'Y-axis Sample Label'. You may change the value for label as per your requirement.
Python Program
import matplotlib.pyplot as plt

# Example data
x = [1, 2, 3, 4, 5]
y = [10, 20, 35, 45, 30]

# Plot the data
plt.plot(x, y, marker='o')

# Add a label to the Y-axis
plt.ylabel('Y-axis Sample Label')

# Show the plot
plt.show()
Output