Matplotlib - Label Location
Matplotlib - Label Location or Position
To set a specific location for a label in Matplotlib, you can use loc parameter of the label functions.
For X-axis label, you can specify 'left', 'center', or 'right' for the loc parameter in the xlabel() function.
For Y-axis label, you can specify 'bottom', 'center', or 'top' for the loc parameter in the ylabel() function.
Label Location for X-axis
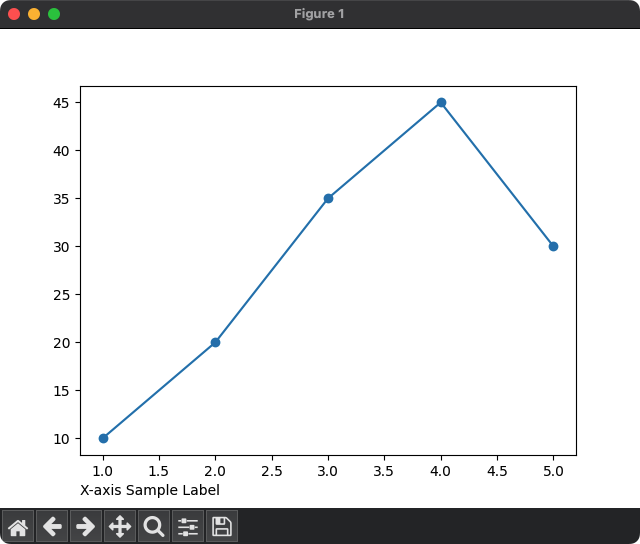
1. Location = left, for X-axis label
In the following program, let us set the location of X-axis label to the 'left'.
Python Program
import matplotlib.pyplot as plt

# Example data
x = [1, 2, 3, 4, 5]
y = [10, 20, 35, 45, 30]

# Plot the data
plt.plot(x, y, marker='o')

# Set location for the X-axis label
plt.xlabel('X-axis Sample Label', loc = 'left')

# Show the plot
plt.show()
Output
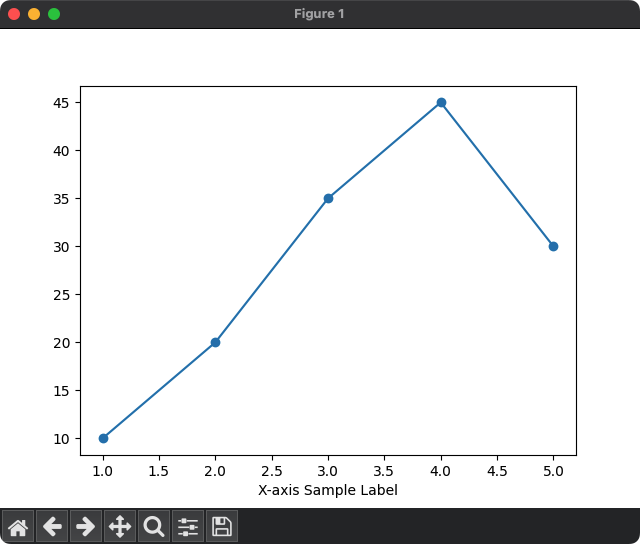
2. Location = center, for X-axis label
In the following program, let us set the location of X-axis label to the 'center'.
Python Program
import matplotlib.pyplot as plt

# Example data
x = [1, 2, 3, 4, 5]
y = [10, 20, 35, 45, 30]

# Plot the data
plt.plot(x, y, marker='o')

# Set location for the X-axis label
plt.xlabel('X-axis Sample Label', loc = 'center')

# Show the plot
plt.show()
Output
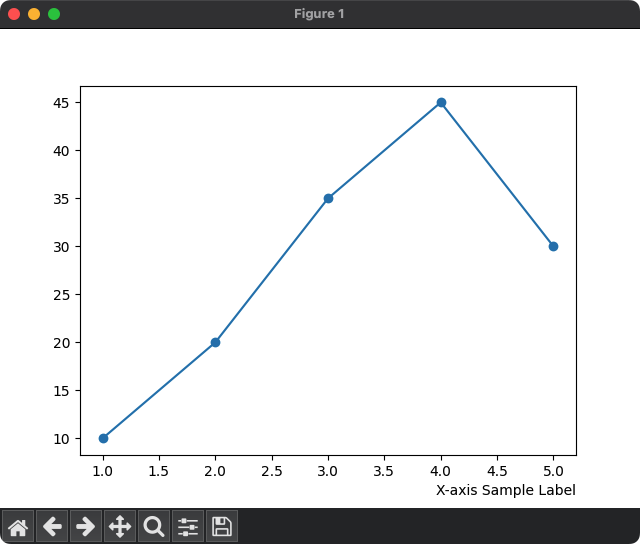
3. Location = right, for X-axis label
In the following program, let us set the location of X-axis label to the 'right'.
Python Program
import matplotlib.pyplot as plt

# Example data
x = [1, 2, 3, 4, 5]
y = [10, 20, 35, 45, 30]

# Plot the data
plt.plot(x, y, marker='o')

# Set location for the X-axis label
plt.xlabel('X-axis Sample Label', loc = 'center')

# Show the plot
plt.show()
Output
Label Location for Y-axis
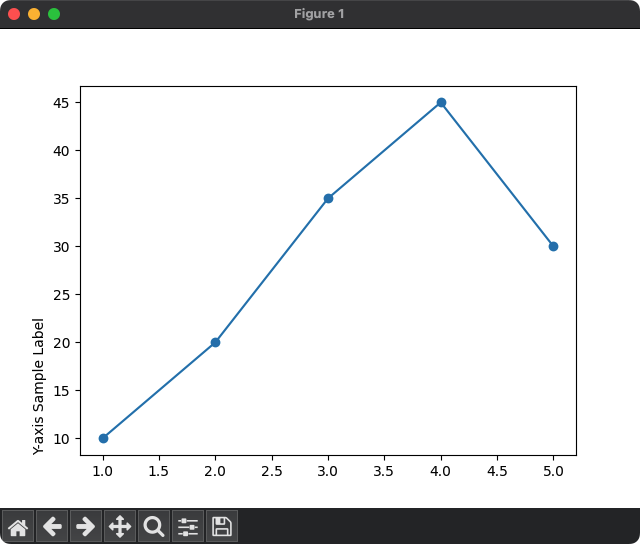
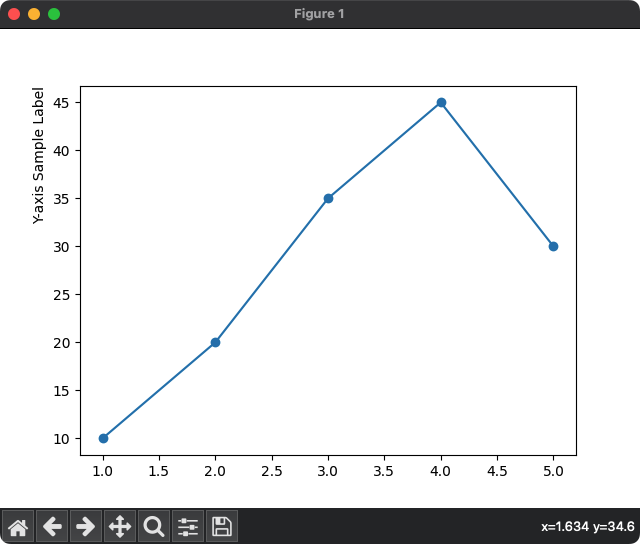
1. Location = top, for Y-axis label
In the following program, let us set the location of Y-axis label to the 'top'.
Python Program
import matplotlib.pyplot as plt

# Example data
x = [1, 2, 3, 4, 5]
y = [10, 20, 35, 45, 30]

# Plot the data
plt.plot(x, y, marker='o')

# Set location for the Y-axis label
plt.ylabel('Y-axis Sample Label', loc = 'top')

# Show the plot
plt.show()
Output
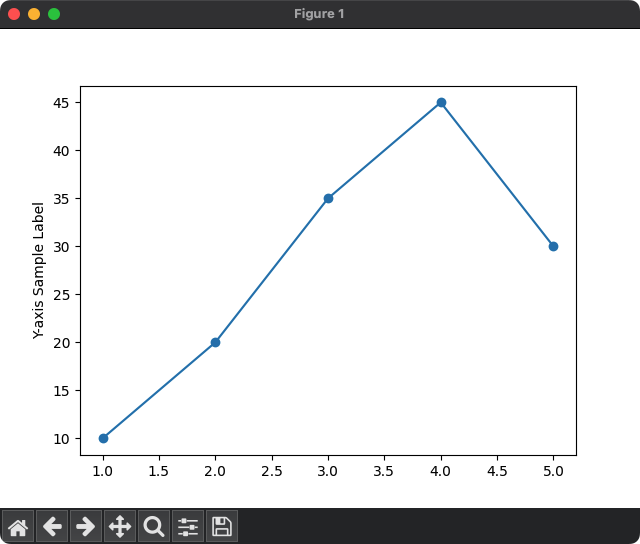
2. Location = center, for Y-axis label
In the following program, let us set the location of Y-axis label to the 'center'.
Python Program
import matplotlib.pyplot as plt

# Example data
x = [1, 2, 3, 4, 5]
y = [10, 20, 35, 45, 30]

# Plot the data
plt.plot(x, y, marker='o')

# Set location for the Y-axis label
plt.ylabel('Y-axis Sample Label', loc = 'center')

# Show the plot
plt.show()
Output
3. Location = bottom, for Y-axis label
In the following program, let us set the location of Y-axis label to the 'bottom'.
Python Program
import matplotlib.pyplot as plt

# Example data
x = [1, 2, 3, 4, 5]
y = [10, 20, 35, 45, 30]

# Plot the data
plt.plot(x, y, marker='o')

# Set location for the Y-axis label
plt.ylabel('Y-axis Sample Label', loc = 'bottom')

# Show the plot
plt.show()
Output