Matplotlib - Grid Color
Matplotlib - Grid Color
In Matplotlib, you can choose a specific color for the grid.
To set a specific color for the grid, call the grid() function from matplotlib.pyplot and pass required color value as the argument for the color parameter.
For example, plt.grid(color='green') displays the grid with green color.
import matplotlib.pyplot as plt
plt.grid(color='green')
You can also give a Hex value for the color.
For example, plt.grid(color='#22BB33') displays the grid with Hex color '#22BB33'.
import matplotlib.pyplot as plt
plt.grid(color='#22BB33')
Examples
1. Grid color using built-in color value in Matplotlib
You can give a built-in color value as argument for the color parameter of grid() function. For example, 'red', 'green', 'yellow', 'aliceblue', 'azure', etc.
In the following program, we shall set the grid color to 'green'.
Python Program
import matplotlib.pyplot as plt

# Example data
x = [1, 2, 3, 4, 5]
y = [10, 20, 25, 55, 40]

# Plot the data
plt.plot(x, y, marker='o')

# Grid with specific color
plt.grid(color='green')

# Show the plot
plt.show()
Output

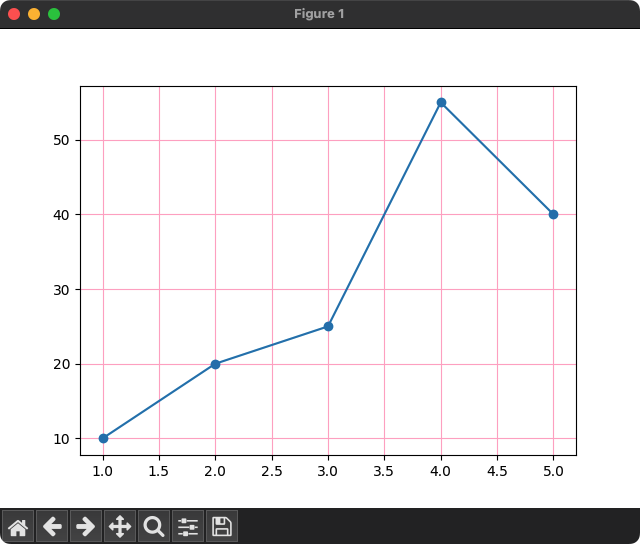
2. Grid color using Hex color value in Matplotlib
You can give a Hex color value as argument for the color parameter of grid() function. For example, '#FFAAC8', '#FF00B2', '#FF78A5', etc.
In the following program, we shall set the grid color to '#FFAAC8'.
Python Program
import matplotlib.pyplot as plt

# Example data
x = [1, 2, 3, 4, 5]
y = [10, 20, 25, 55, 40]

# Plot the data
plt.plot(x, y, marker='o')

# Grid with specific color
plt.grid(color='#FFAAC8')

# Show the plot
plt.show()
Output