Matplotlib - Title Color
Matplotlib - Title Color
To set a specific color for the title of the plot in Matplotlib, you can use color parameter of the title() function.
plt.title('Sample Plot', color='red')You can replace 'red' with the color value of your choice as per the requirement.
You can also use a HEX value for the color, as shown in the following.
plt.title('Sample Plot', color='red')This customization allows you to tailor the appearance of your plot title to match the overall style of your visualizations.
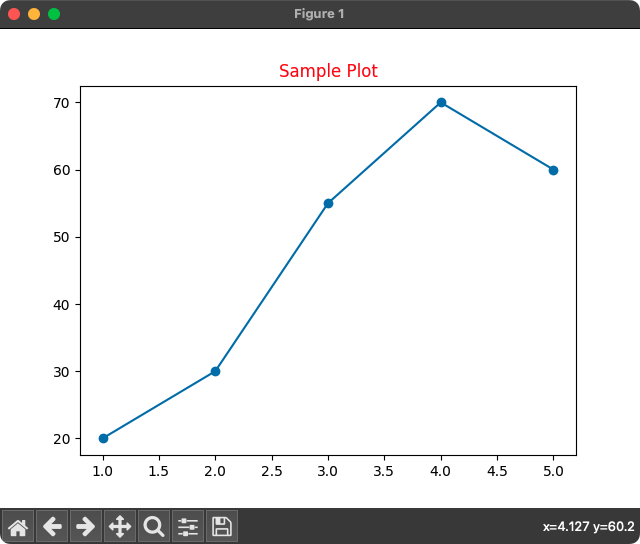
1. color="red" Title in Maplotlib
In the following program, we shall 25 as font size for the title of plot.
Python Program
import matplotlib.pyplot as plt

# Example data
x = [1, 2, 3, 4, 5]
y = [20, 30, 55, 70, 60]

# Plot line
plt.plot(x, y, marker='o')

# Set title, with specific color
plt.title('Sample Plot', color='red')

# Show the plot
plt.show()
Output
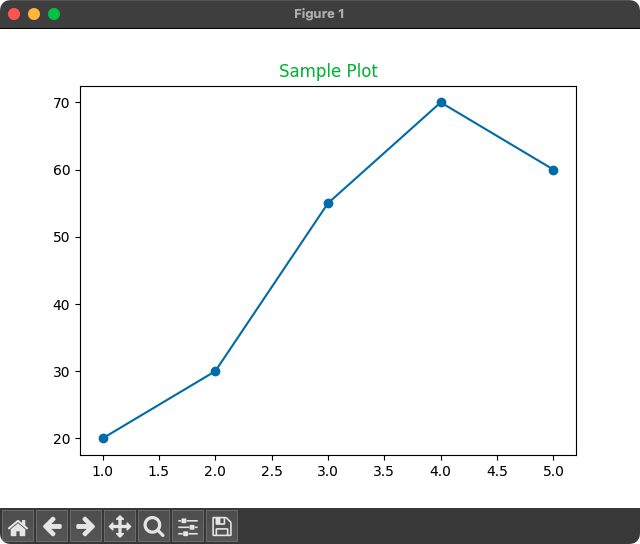
2. Hex color value of "#22BB33" for Title in Maplotlib
In the following program, we shall 25 as font size for the title of plot.
Python Program
import matplotlib.pyplot as plt

# Example data
x = [1, 2, 3, 4, 5]
y = [20, 30, 55, 70, 60]

# Plot line
plt.plot(x, y, marker='o')

# Set title, with specific color
plt.title('Sample Plot', color='#22BB33')

# Show the plot
plt.show()
Output