Matplotlib - Display Grid only Along Y-axis
Matplotlib - Display grid only along Y-axis
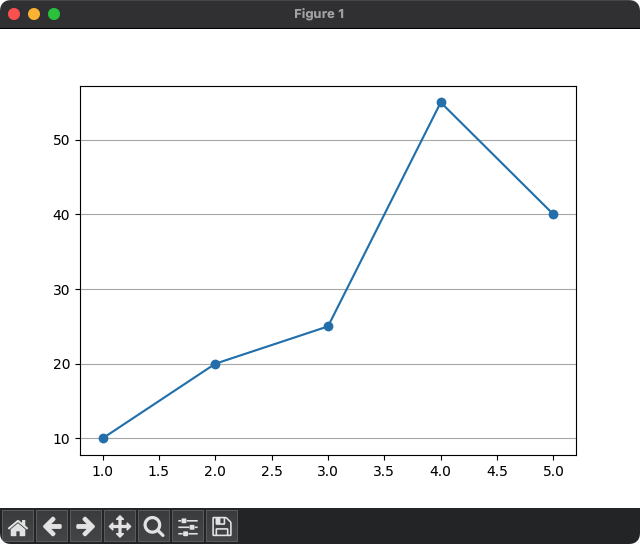
In Matplotlib, you can choose to display only the grid along the Y-axis.
To display grid only along the Y-axis, call the grid() function from matplotlib.pyplot and pass 'y' as the argument for the axis parameter.
For example, plt.grid(axis='y') displays the grid only along the Y-axis.
import matplotlib.pyplot as plt
plt.grid(axis='y')
Example for Grid along Y-axis
In the following program, we shall display a plot with a line, and display grid along only Y-axis using grid() function.
Python Program
import matplotlib.pyplot as plt

# Example data
x = [1, 2, 3, 4, 5]
y = [10, 20, 25, 55, 40]

# Plot the data
plt.plot(x, y, marker='o')

# Add a grid to the plot only along Y-axis
plt.grid(axis='y')

# Show the plot
plt.show()
Output