Matplotlib – Plot Line Width
Matplotlib – Plot Line Width Tutorial
In this tutorial, we’ll create a simple plot with a custom line width using Matplotlib in Python.
1. Import Matplotlib.pyplot
Import the Matplotlib library, specifically the pyplot module.
import matplotlib.pyplot as plt2. Create Data
Define the data points for the X and Y axes.
x = [1, 2, 3, 4, 5]
y = [20, 30, 55, 70, 60]
In this case, x represents the values on the X-axis, and y represents the corresponding values on the Y-axis.
3. Plot Line with Custom Width
Use Matplotlib to plot a line with a specified line width.
plt.plot(x, y, linewidth=2, marker='o')linewidth: This parameter determines the width of the line in the plot.
Choose a numerical value for the line width (e.g., 2, 3, 4, etc.).
The default line width is 1.
4. Customize and show the plot
Customize the plot with labels and titles, and then show the plot in a figure.
plt.title('Line Width Plot Example')
plt.xlabel('X-axis Label')
plt.ylabel('Y-axis Label')
plt.show()
Complete program to plot Line with Custom Width using Matplotlib
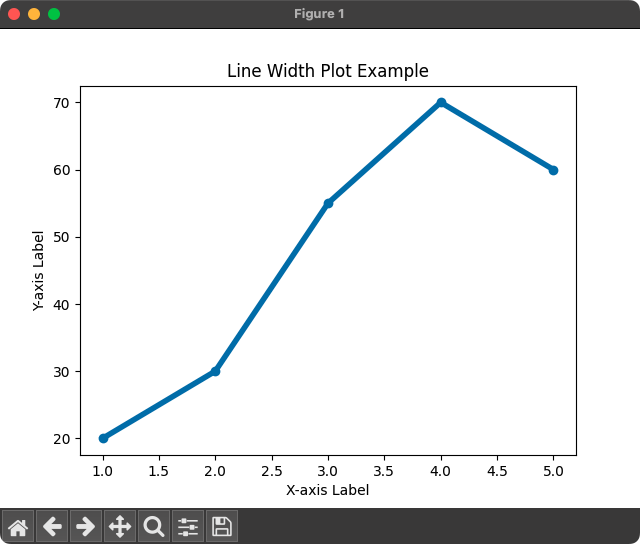
Using all the above steps, let us write the complete program to draw a line with a specified width using Matplotlib plot() function.
Python Program
import matplotlib.pyplot as plt

# Example data
x = [1, 2, 3, 4, 5]
y = [20, 30, 55, 70, 60]

# Plot line with custom width
plt.plot(x, y, linewidth=4, marker='o')

# Customize plot
plt.title('Line Width Plot Example')
plt.xlabel('X-axis Label')
plt.ylabel('Y-axis Label')

# Show the plot
plt.show()
Output
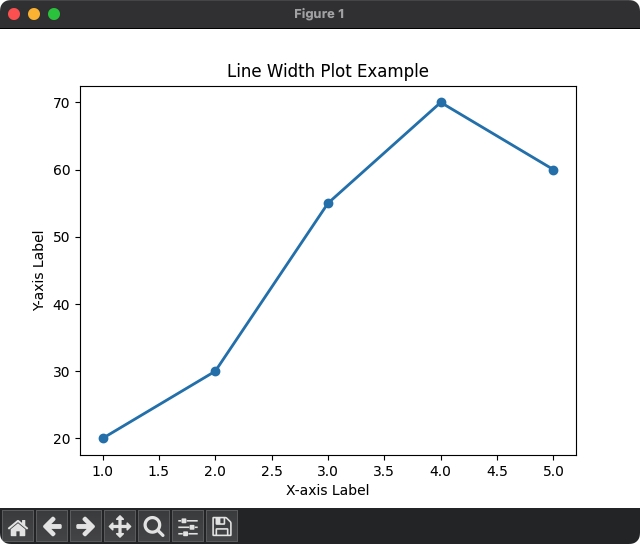
Now, let us take a line width of 2 for the plot.
Python Program
import matplotlib.pyplot as plt

# Example data
x = [1, 2, 3, 4, 5]
y = [20, 30, 55, 70, 60]

# Plot line with custom width
plt.plot(x, y, linewidth=2, marker='o')

# Customize plot
plt.title('Line Width Plot Example')
plt.xlabel('X-axis Label')
plt.ylabel('Y-axis Label')

# Show the plot
plt.show()
Output
Summary
That concludes our tutorial on creating a plot with a line of a custom width using Matplotlib in Python!