Matplotlib - Plot line with random values
Matplotlib - Plot Line with Random Values
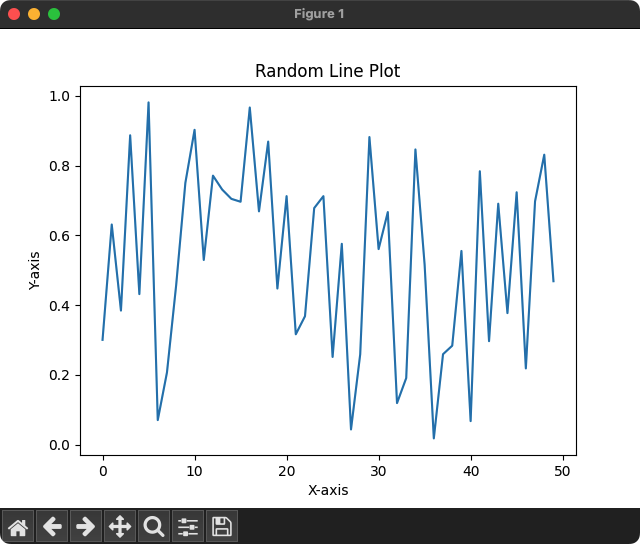
In this tutorial, we'll use Matplotlib in Python to create a line plot with randomly generated values.
The following is a step by step tutorial on how to generate random data and visualize it as a line plot using Matplotlib.
1. Import Necessary Libraries
Begin by importing the required libraries, including Matplotlib and NumPy for generating random data.
import matplotlib.pyplot as plt
import numpy as np
2. Generate Random Data
Take a range for values for X axis, and an array of random values for the Y axis using NumPy's numpy.random.rand() function.
# Number of data points
num_points = 50

# Take sequential values for X
x_values = range(num_points)

# Generate random values for Y
y_values = np.random.rand(num_points)
3. Plot Line
Use Matplotlib's plot() function to create a line plot with the generated random values.
# Plot the line
plt.plot(x_values, y_values, label='Random Line')
4. Customize and Show the Plot
Customize the plot by adding a title, labels for the X and Y axes, and a legend. Finally, display the plot using show().
# Customize the plot
plt.title('Random Line Plot')
plt.xlabel('X-axis')
plt.ylabel('Y-axis')

# Show the plot
plt.show()
Complete Program
Let us write a program with all the steps mentioned above, to plot line with random values using Matplotlib, and run the program.
Python Program
import matplotlib.pyplot as plt
import numpy as np

# Number of data points
num_points = 50

# Take sequential values for X
x_values = range(num_points)
# Generate random values for Y
y_values = np.random.rand(num_points)

# Plot the line
plt.plot(x_values, y_values, label='Random Line')

# Customize the plot
plt.title('Random Line Plot')
plt.xlabel('X-axis')
plt.ylabel('Y-axis')

# Show the plot
plt.show()
Output

Summary
This tutorial demonstrated how to use Matplotlib to generate a line plot with random values. You can customize the number of data points and further enhance the plot to suit your specific requirements.