Matplotlib - Plot Title
Matplotlib - Plot Title Tutorial
To set a specific title for the plot in Matplotlib, you can use title() function of matplotlib.pyplot.
In this tutorial, we shall draw a line plot, and specify a title 'Line Plot 1'.
Python Program
import matplotlib.pyplot as plt

# Example data
x = [1, 2, 3, 4, 5]
y = [20, 30, 55, 70, 60]

# Plot line
plt.plot(x, y, marker='o')

# Set title
plt.title('Lines Plot 1')

# Other plot customizations
plt.xlabel('X-axis Label')
plt.ylabel('Y-axis Label')

# Show the plot
plt.show()
Output
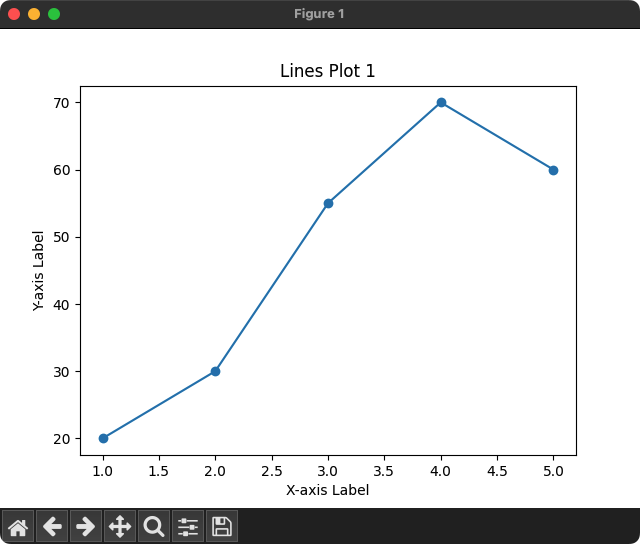
In the above program, plt.title('Lines Plot 1') statement sets the title for the plot.