Python Matplotlib - Bar Plot Adding Error Bars
Python Matplotlib - Bar Plot Adding Error Bars
Error bars are a useful tool in bar plots to visualize the variability or uncertainty in data. Python's Matplotlib library provides a way to add error bars to bar plots. In this tutorial, you will learn how to include and customize error bars in your bar charts.
Adding Error Bars to a Bar Plot
You can add error bars to a bar plot using the yerr parameter in the plt.bar() function. This parameter specifies the error values for each bar.
Example 1: Basic Bar Plot with Error Bars
import matplotlib.pyplot as plt
import numpy as np

# Data for the bar plot
categories = ['Category A', 'Category B', 'Category C', 'Category D']
values = [20, 35, 30, 35]
errors = [2, 3, 4, 1]  # Error values

# Create the bar plot with error bars
plt.bar(categories, values, yerr=errors, capsize=5, color='skyblue', edgecolor='black')

# Add labels and title
plt.xlabel('Categories')
plt.ylabel('Values')
plt.title('Bar Plot with Error Bars')

# Show the plot
plt.show()
Explanation
yerrspecifies the error values for each bar.capsizecontrols the size of the caps at the ends of the error bars.- The
colorandedgecolorparameters style the bars.

Customizing Error Bars
Matplotlib allows you to customize the appearance of error bars for better visualization.
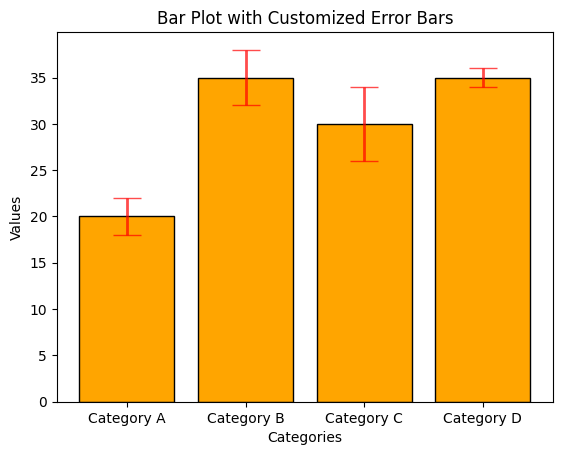
Example 2: Custom Error Bar Style
import matplotlib.pyplot as plt
import numpy as np

# Data for the bar plot
categories = ['Category A', 'Category B', 'Category C', 'Category D']
values = [20, 35, 30, 35]
errors = [2, 3, 4, 1]  # Error values

# Create the bar plot with customized error bars
plt.bar(categories, values, yerr=errors, capsize=10, color='orange', edgecolor='black',
        error_kw={'ecolor': 'red', 'elinewidth': 2, 'alpha': 0.7})

# Add labels and title
plt.xlabel('Categories')
plt.ylabel('Values')
plt.title('Bar Plot with Customized Error Bars')

# Show the plot
plt.show()
Explanation
- The
error_kwparameter customizes the error bars, including:ecolor: Sets the color of the error bars.elinewidth: Adjusts the thickness of the error bars.alpha: Adds transparency to the error bars.
capsizeis increased for better visibility of the caps.
Bar Plot with Asymmetric Error Bars
In some cases, you may want to use different error values for the upper and lower bounds of the bars. Matplotlib supports this using yerr with a tuple or array.
Example 3: Asymmetric Error Bars
import matplotlib.pyplot as plt
import numpy as np

# Data for the bar plot
categories = ['Category A', 'Category B', 'Category C', 'Category D']
values = [20, 35, 30, 35]
errors = [[2, 1, 3, 2], [3, 4, 2, 1]]  # Asymmetric error values (lower, upper)

# Create the bar plot with asymmetric error bars
plt.bar(categories, values, yerr=errors, capsize=5, color='green', edgecolor='black')

# Add labels and title
plt.xlabel('Categories')
plt.ylabel('Values')
plt.title('Bar Plot with Asymmetric Error Bars')

# Show the plot
plt.show()
Explanation
- The
yerrparameter is specified as a list of two arrays: one for lower errors and one for upper errors. - Error bars are drawn asymmetrically based on the provided values.

Summary
In this tutorial, we covered:
- Adding error bars to bar plots using the
yerrparameter. - Customizing error bars with parameters like
ecolorandelinewidth. - Using asymmetric error bars to represent different upper and lower bounds.
By incorporating error bars, you can effectively represent data variability and uncertainty in your bar plots.