Python Matplotlib - Pie Chart Example
Matplotlib - Pie Chart
To draw a Pie chart using Matplotlib python library, use matplotlib.pyplot.pie() function.
In this tutorial, we shall go through some Python example programs which demonstrate the usage of pyplot.pie() function to draw a pie chart in Python.
Example
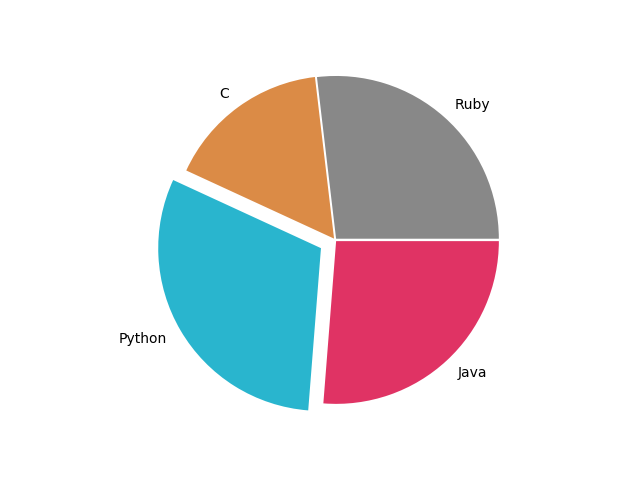
In the following example, we have taken four sectors. The labels and sizes for these sectors are defined by labels and sizes respectively in the program. The size is used to calculate the angle of the sector.
Python Program
import matplotlib.pyplot as plt

# Data to plot
labels = 'Ruby', 'C', 'Python', 'Java'
sizes = [215, 130, 245, 210]
colors = ['#888888', '#db8b46', '#29b5ce', '#e03364']
explode = (0.01, 0.01, 0.1, 0.01)  # explode 1st slice

# Plot
plt.pie(sizes, explode=explode, labels=labels, colors=colors)

plt.axis('equal')
plt.show()
Explanation
- The program uses the
matplotlib.pyplotlibrary to create a pie chart. - The
labelslist contains the names of the programming languages ('Ruby', 'C', 'Python', 'Java'). - The
sizeslist contains the corresponding sizes for each slice of the pie chart (215, 130, 245, 210). - The
colorslist specifies the colors for each slice in hexadecimal format. - The
explodetuple is used to highlight the 3rd slice (Python) by slightly "exploding" it from the rest of the pie chart. - The
plt.pie()function creates the pie chart with the specified data, labels, colors, and explode effect. plt.axis('equal')ensures that the pie chart is drawn as a circle, rather than an ellipse.plt.show()displays the pie chart to the user.
Output
Summary
In this tutorial of Python Examples, we learned how to draw a Pie Chart using Matplotlib.