Python Matplotlib Stackplot - Modify Space between Stacked Areas
Python Matplotlib Stackplot - Modify Space between Stacked Areas
In Matplotlib, stackplots are a great way to visualize cumulative data across multiple categories. By default, stacked areas in a stackplot are placed directly on top of each other without any gaps. However, you can modify the space between the stacked areas to improve clarity and aesthetics. This tutorial will guide you through creating stackplots with adjustable spacing.
We will cover:
- Default stackplot with no spacing between areas.
- Adding space between stacked areas using offsets.
- Advanced customization of spacing and alignment.
Default Stackplot without Spacing
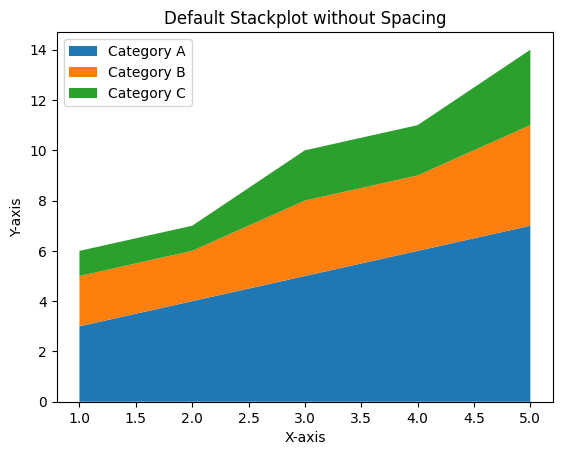
By default, stacked areas in a stackplot are contiguous. Here's an example of the default behavior:
Example 1: Basic Stackplot
import matplotlib.pyplot as plt

# Data for the stackplot
x = [1, 2, 3, 4, 5]
y1 = [3, 4, 5, 6, 7]
y2 = [2, 2, 3, 3, 4]
y3 = [1, 1, 2, 2, 3]

# Create a stackplot
plt.stackplot(x, y1, y2, y3, labels=['Category A', 'Category B', 'Category C'])

# Add title, legend, and labels
plt.title('Default Stackplot without Spacing')
plt.xlabel('X-axis')
plt.ylabel('Y-axis')
plt.legend(loc='upper left')

# Show the plot
plt.show()
Explanation
- The
plt.stackplot()function creates a stackplot where areas are stacked without any gaps. - The areas represent cumulative data for the categories.

Adding Space between Stacked Areas
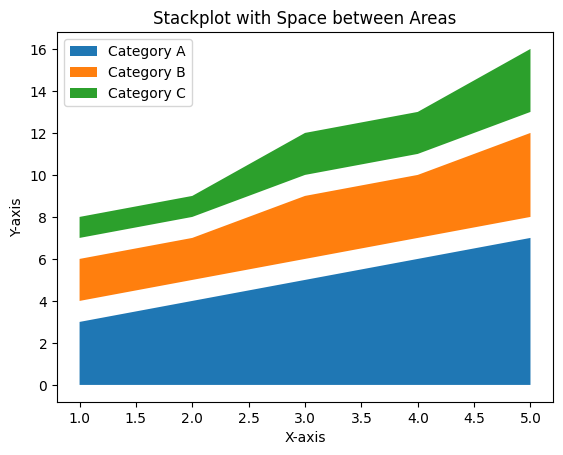
You can add space between stacked areas by manually adjusting the values of the datasets. This involves adding offsets to create gaps between the areas.
Example 2: Stackplot with Spacing
import matplotlib.pyplot as plt
import numpy as np

# Data for the stackplot
x = [1, 2, 3, 4, 5]
y1 = np.array([3, 4, 5, 6, 7])
y2 = np.array([2, 2, 3, 3, 4])
y3 = np.array([1, 1, 2, 2, 3])

# Add offsets to introduce spacing
offset = 1
y2_with_offset = y1 + offset + y2
y3_with_offset = y2_with_offset + offset + y3

# Create a stackplot with spacing
plt.fill_between(x, y1, label='Category A')
plt.fill_between(x, y2_with_offset, y1 + offset, label='Category B')
plt.fill_between(x, y3_with_offset, y2_with_offset + offset, label='Category C')

# Add title, legend, and labels
plt.title('Stackplot with Space between Areas')
plt.xlabel('X-axis')
plt.ylabel('Y-axis')
plt.legend(loc='upper left')

# Show the plot
plt.show()
Explanation
- Offsets are added to the cumulative sums of the datasets to introduce space between the stacked areas.
- The
fill_betweenfunction is used to define the boundaries for each stacked area. - Each area is visually separated by the specified offset value.

Advanced Customization of Spacing
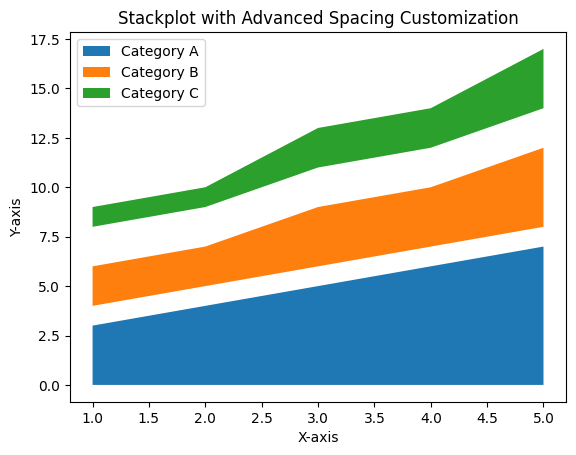
For more control over the spacing, you can use non-uniform offsets or apply different gaps for each area. This approach is useful for highlighting specific data categories.
Example 3: Advanced Spacing Customization
import matplotlib.pyplot as plt
import numpy as np

# Data for the stackplot
x = [1, 2, 3, 4, 5]
y1 = np.array([3, 4, 5, 6, 7])
y2 = np.array([2, 2, 3, 3, 4])
y3 = np.array([1, 1, 2, 2, 3])

# Define non-uniform offsets
offsets = [1, 2, 1]

# Apply offsets to create gaps
y2_with_offset = y1 + offsets[0] + y2
y3_with_offset = y2_with_offset + offsets[1] + y3

# Create stackplot with non-uniform spacing
plt.fill_between(x, y1, label='Category A')
plt.fill_between(x, y2_with_offset, y1 + offsets[0], label='Category B')
plt.fill_between(x, y3_with_offset, y2_with_offset + offsets[1], label='Category C')

# Add title, legend, and labels
plt.title('Stackplot with Advanced Spacing Customization')
plt.xlabel('X-axis')
plt.ylabel('Y-axis')
plt.legend(loc='upper left')

# Show the plot
plt.show()
Explanation
- Non-uniform offsets are defined for each gap to create varied spacing.
- The
fill_betweenfunction ensures each area is plotted with its respective gap. - This customization provides better flexibility for emphasizing certain categories.

Summary
In this tutorial, we explored:
- The default behavior of stackplots with no spacing between areas.
- Adding uniform spacing between stacked areas using offsets.
- Advanced customization with non-uniform spacing to highlight specific categories.
By modifying the space between stacked areas, you can make your stackplots clearer and more visually appealing, especially when dealing with complex datasets.