Python Matplotlib Subplot Different Sizes - Customizing Plot Dimensions
Creating Subplots of Different Sizes in Matplotlib
Matplotlib provides tools like GridSpec to create subplots with varying sizes within the same figure. This is especially useful when visualizing data of different types or importance. In this tutorial, we’ll explore methods to achieve this with practical examples.
Key Approach: Using GridSpec
The GridSpec class from matplotlib.gridspec allows flexible control over subplot sizes and arrangements. By defining row and column spans, you can customize each subplot's size.
Example 1: Basic Subplots with Different Sizes
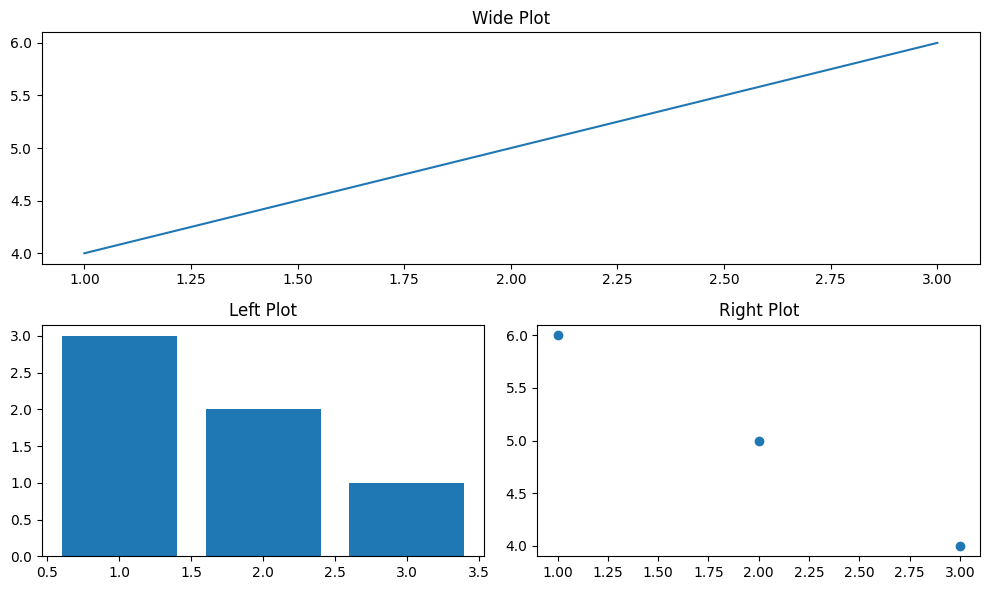
This example demonstrates how to create a simple layout with varying subplot sizes.
import matplotlib.pyplot as plt
from matplotlib.gridspec import GridSpec

# Create a figure
fig = plt.figure(figsize=(10, 6))

# Define GridSpec layout
gs = GridSpec(2, 2, figure=fig)

# Create subplots with varying spans
ax1 = fig.add_subplot(gs[0, :])  # Top subplot spanning two columns
ax2 = fig.add_subplot(gs[1, 0])  # Bottom-left subplot
ax3 = fig.add_subplot(gs[1, 1])  # Bottom-right subplot

# Add data and titles
ax1.plot([1, 2, 3], [4, 5, 6])
ax1.set_title('Wide Plot')

ax2.bar([1, 2, 3], [3, 2, 1])
ax2.set_title('Left Plot')

ax3.scatter([1, 2, 3], [6, 5, 4])
ax3.set_title('Right Plot')

# Adjust layout
plt.tight_layout()

# Display the plot
plt.show()
Explanation
GridSpec(2, 2)creates a 2x2 grid.ax1spans the entire top row usinggs[0, :].ax2andax3occupy the bottom-left and bottom-right cells respectively.

Example 2: Complex Layout with Custom Sizes
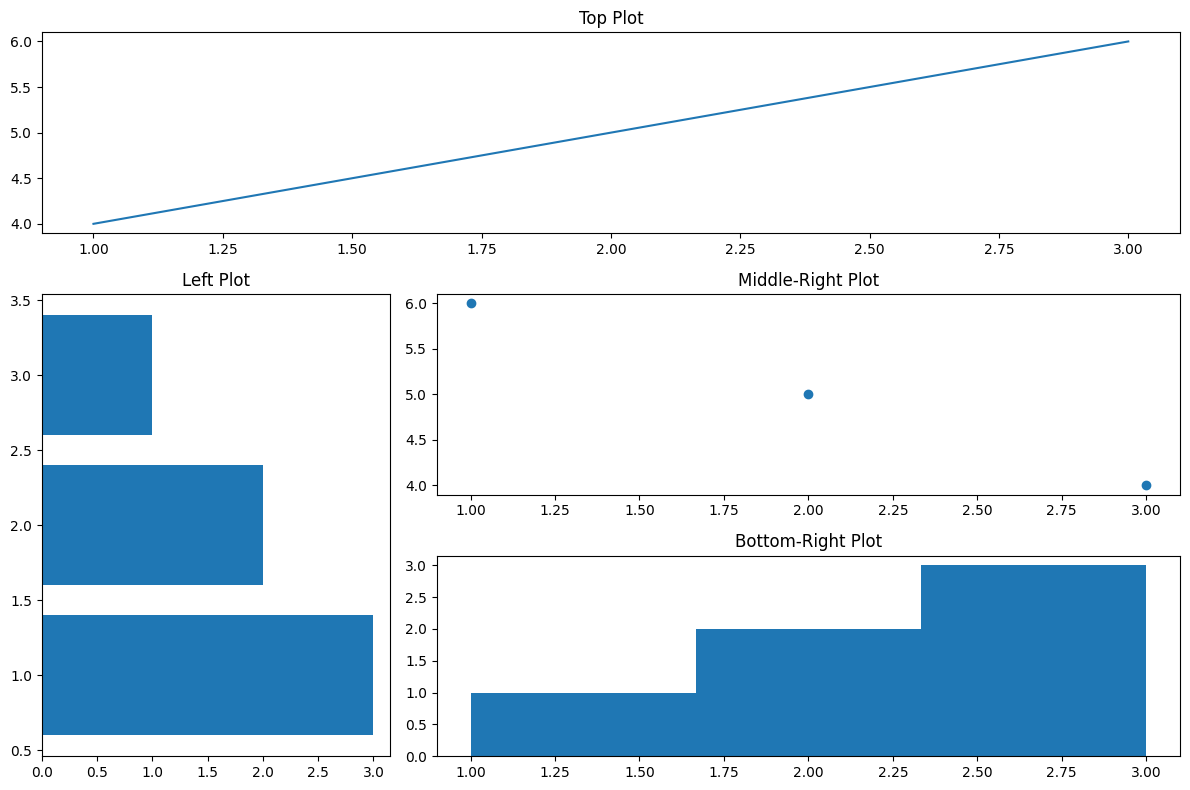
This example illustrates a more complex layout with unequal subplot sizes.
import matplotlib.pyplot as plt
from matplotlib.gridspec import GridSpec

# Create a figure
fig = plt.figure(figsize=(12, 8))

# Define GridSpec layout
gs = GridSpec(3, 3, figure=fig)

# Create subplots
ax1 = fig.add_subplot(gs[0, :])      # Top subplot spanning all columns
ax2 = fig.add_subplot(gs[1:, 0])    # Left subplot spanning two rows
ax3 = fig.add_subplot(gs[1, 1:])    # Middle-right subplot
ax4 = fig.add_subplot(gs[2, 1:])    # Bottom-right subplot

# Add data and titles
ax1.plot([1, 2, 3], [4, 5, 6])
ax1.set_title('Top Plot')

ax2.barh([1, 2, 3], [3, 2, 1])
ax2.set_title('Left Plot')

ax3.scatter([1, 2, 3], [6, 5, 4])
ax3.set_title('Middle-Right Plot')

ax4.hist([1, 2, 2, 3, 3, 3], bins=3)
ax4.set_title('Bottom-Right Plot')

# Adjust layout
plt.tight_layout()

# Display the plot
plt.show()
Explanation
GridSpec(3, 3)creates a 3x3 grid.ax1spans the entire top row.ax2occupies the leftmost two rows.ax3andax4occupy the right columns of the second and third rows respectively.

Summary
In this tutorial, you learned:
- How to create subplots of different sizes using
GridSpec. - How to customize layouts for varying data types.
- How to use nested grids for advanced subplot arrangements.
These techniques enable precise control over your visualizations, enhancing their clarity and impact.