Python Matplotlib Subplot Grid - Creating Flexible Grid Layouts
Creating Flexible Subplot Grids in Matplotlib
Matplotlib offers multiple ways to create subplot grids for organizing visualizations. Using plt.subplots or GridSpec, you can create and customize flexible grid layouts for your plots. This tutorial explores these methods with detailed examples.
Key Methods for Subplot Grids
There are two main approaches to creating subplot grids:
plt.subplots(): Simple and quick method to create evenly spaced grids.matplotlib.gridspec.GridSpec: Offers more flexibility for custom layouts and varying subplot sizes.
Example 1: Using plt.subplots() for a Uniform Grid
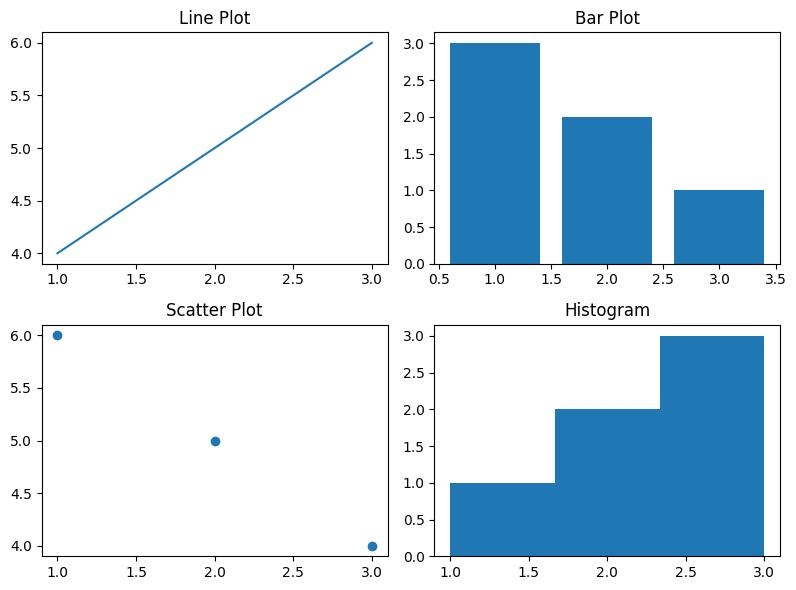
The plt.subplots() method provides a quick way to create evenly spaced grids of subplots.
import matplotlib.pyplot as plt

# Create a 2x2 grid of subplots
fig, ax = plt.subplots(2, 2, figsize=(8, 6))

# Add data to each subplot
ax[0, 0].plot([1, 2, 3], [4, 5, 6])
ax[0, 0].set_title('Line Plot')

ax[0, 1].bar([1, 2, 3], [3, 2, 1])
ax[0, 1].set_title('Bar Plot')

ax[1, 0].scatter([1, 2, 3], [6, 5, 4])
ax[1, 0].set_title('Scatter Plot')

ax[1, 1].hist([1, 2, 2, 3, 3, 3], bins=3)
ax[1, 1].set_title('Histogram')

# Adjust layout
plt.tight_layout()

# Display the plot
plt.show()
Explanation
plt.subplots(2, 2)creates a grid of 2 rows and 2 columns.- Each subplot is populated with different types of plots.
plt.tight_layout()ensures no overlapping elements.
Output

Example 2: Using GridSpec for Custom Layouts
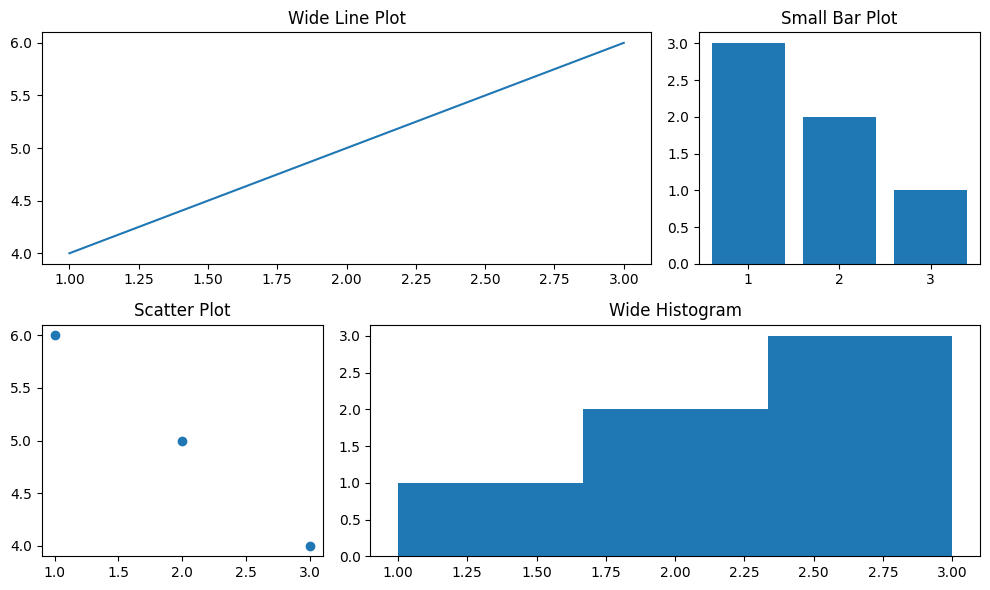
The GridSpec class provides finer control over subplot layouts, allowing you to create subplots of different sizes and arrangements.
import matplotlib.pyplot as plt
from matplotlib.gridspec import GridSpec

# Create a figure
fig = plt.figure(figsize=(10, 6))

# Define a GridSpec layout
gs = GridSpec(2, 3, figure=fig)

# Add subplots with custom spans
ax1 = fig.add_subplot(gs[0, 0:2])
ax2 = fig.add_subplot(gs[0, 2])
ax3 = fig.add_subplot(gs[1, 0])
ax4 = fig.add_subplot(gs[1, 1:3])

# Add data to each subplot
ax1.plot([1, 2, 3], [4, 5, 6])
ax1.set_title('Wide Line Plot')

ax2.bar([1, 2, 3], [3, 2, 1])
ax2.set_title('Small Bar Plot')

ax3.scatter([1, 2, 3], [6, 5, 4])
ax3.set_title('Scatter Plot')

ax4.hist([1, 2, 2, 3, 3, 3], bins=3)
ax4.set_title('Wide Histogram')

# Adjust layout
plt.tight_layout()

# Display the plot
plt.show()
Explanation
GridSpec(2, 3)defines a grid with 2 rows and 3 columns.- Subplots are positioned and sized using slicing (e.g.,
gs[0, 0:2]spans the first two columns of the first row). plt.tight_layout()optimizes spacing automatically.
Output

Summary
In this tutorial, you learned:
- How to create uniform grids using
plt.subplots(). - How to customize grids with
GridSpecfor complex layouts. - How to use nested grids for advanced subplot organization.
These techniques empower you to create clear, organized, and visually appealing visualizations, regardless of complexity.